Sourcing City has published White Paper No. 04
The Intelligent Distributor, an argument-led field report on how data and AI are redrawing the competitive line in UK promotional merchandise.
Read moreIf it’s happening, it’s here…
Europe's promotional merchandise market stood still in 2025. The UK and Ireland did not. Our own Market Report and a new European study from ASI tell the same story from two directions, and the gap between them is worth understanding
|
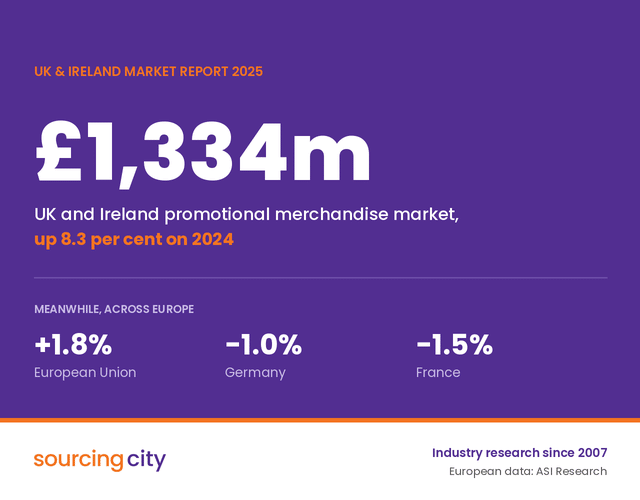
Industry Research Europe’s promotional merchandise market stood still in 2025. The UK and Ireland did not. Our own Market Report and a new European study from ASI tell the same story from two directions, and the gap between them is worth understanding. Sourcing City industry research | European data from ASI Research | August 2026 Our data: a market that grewThe Sourcing City Market Report puts the UK and Ireland promotional merchandise market at £1,334m for 2025, up from £1,232m in 2024. That is growth of 8.3 per cent, and it takes the market to its highest recorded level in the nineteen years we have been compiling this research. We are careful about what that number means. A meaningful share of the increase reflects price inflation across products, freight and operating costs rather than additional business won. In real terms the year was steadier than the headline suggests. But it was not a decline, and across most of Europe it was. There is a second figure that supports the first. Click through enquiries on Sourcing City reached 675,000 in 2025, up from 624,000 the year before. That is a rise of 8.2 per cent, almost exactly in step with market value. Enquiry activity is a measure of intent rather than price, so the two moving together suggests genuine demand underneath the inflation, not simply the same volume of business at higher cost. ASI’s data: a continent that did notASI Research has just published the fourth edition of its annual European market study, covering the UK, the 27 EU nations, and Iceland, Norway and Switzerland. It estimates that European distributors turned over 14.83 billion dollars in 2025, a low single digit rise on the year. That rise needs an asterisk, and ASI supplies one. Much of it came from upward revisions to their own estimates for the Netherlands and Poland rather than from new business. Strip those revisions out and the European market would most likely have contracted. The country level picture is starker than the total. Germany, still Europe’s largest market, fell for a third consecutive year to 2.97 billion dollars, leaving it around 3.4 per cent below its 2022 level. France contracted by roughly 1.5 per cent. The EU as a whole managed 1.8 per cent, behind the 4.2 per cent reported in the United States, and even that American number was inflated by tariff driven price rises. The stronger performers were the Scandinavian markets, Poland, and the UK. Two studies, two scopesASI also publishes a UK estimate, and at 2.26 billion dollars it is considerably larger than ours. Converted at the 2025 average exchange rate that is about £1,713m, against our £1,334m. Anyone reading both reports deserves an explanation of the difference, so here it is. The two studies are not measuring the same market. Ours deliberately excludes several categories of trade: printers, clothing specialists, direct supplier sales, sales promotion agencies operating in the premiums market, and the incentives and motivation programme market. Those exclusions have been in place since 2007, which is precisely what makes our year on year comparisons meaningful. Broader definitions produce bigger numbers. Neither approach is wrong, but they are not interchangeable. The figure the two studies genuinely share is the direction of travel. The growth rate ASI reports for the UK is the one we supplied, and it is drawn from the same dataset that produces the £1,334m below. |
| 2025 market value, the two studies side by side | ||
| Market | Value | Year on year |
| UK and Ireland, Sourcing City | £1,334m | up 8.3% |
| United Kingdom, ASI estimate | £1,713m | up around 8% |
| Germany, ASI estimate | £2,252m | down around 1% |
| France, ASI estimate | £1,247m | down around 1.5% |
| Europe in total, ASI estimate | £11,243m | broadly flat |
| ASI publishes in US dollars. Sterling equivalents calculated at the 2025 average rate of 1.319. The two studies use different market definitions, so the values are not directly comparable. | ||
Where both studies agreeSet the totals aside and the two pieces of research converge almost completely on behaviour, which is the part distributors can actually act on. ASI’s interviewees describe buyers across Europe ordering exact quantities rather than round numbers, placing orders later, and splitting the same budget across more, smaller purchases. Order counts rise while order values fall. Our own data shows the same shift from a different angle: seasonality has materially weakened, with enquiry activity now spread far more evenly across the year than it was five years ago. Promotional merchandise is increasingly embedded in continuous marketing activity rather than confined to fixed campaign cycles. Both point at the same conclusion. Buying decisions are being made faster, later, and with less tolerance for guesswork, which puts a premium on accurate, accessible product information at the moment of selection. The studies also agree on consolidation. ASI documents American firms buying their way into Europe through distributor acquisitions. Our figures show the UK trade concentrating under its own steam: 197 distributors now turn over £1m or more, a 14 per cent increase on the year, and between them they account for 61.7 per cent of all market spend. The market has 3,008 distributors in it, so roughly six per cent of companies handle very nearly two thirds of the money. The argument the industry has to winThe strongest theme in ASI’s study has nothing to do with products. It concerns where promotional merchandise sits in the marketing budget, and the warning from their research lead is blunt: on both sides of the Atlantic, promo needs to reassert itself as necessary marketing spend rather than discretionary spend, because discretionary spend is what gets cut first. Several of those interviewed arrive at the same conclusion independently. The businesses that come through this period ahead will not be the ones with the widest range or the keenest price, but the ones that can show what their work delivered. That matches what our own supplier data has been saying for two years. As ranges expand, distributor attention becomes more selective, concentrating on a smaller subset of products. Adding more items to a catalogue does not create more opportunity. Visibility, accuracy and responsiveness at the point of selection do. Jason Grenham, Sales Director at Sourcing City, gave ASI the UK view. “If you take out increased prices, the UK market still probably showed small growth,” he said, noting that a difficult year had ended with much of the UK trade in reasonable health. Speaking to ASI earlier this summer, he also pointed to a stronger than expected start to 2026 among several of our larger members. Set against a European market that has spent the year treading water, that is a position worth defending. |
|
Three things to take from this Smaller and later is the new normal. Build quoting, stock and resourcing decisions around exact quantities and shorter lead times. The pattern is European wide and shows no sign of reverting. Evidence beats range. Clients scrutinising budgets need proof of return, not a longer product list. This applies to suppliers pitching distributors just as much as distributors pitching end users. Watch the EU regulatory pipeline. Digital Product Passport requirements will reach anyone trading textiles into the EU well before they start to feel urgent. |
|