INDUSTRY NEWS
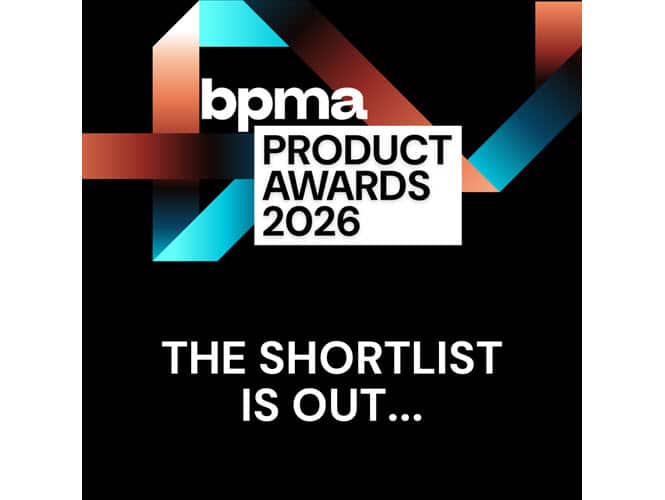
BPMA Product Awards 2026 Shortlist Announced
The quality of entries submitted for this year’s BPMA Product Awards has been truly outstanding, with suppliers showcasing…
Read moreIf it’s happening, it’s here…
 INDUSTRY NEWS
PPAI has published the first end to end economic impact study of the branded merchandise industry, carried out by Oxford Economics.
| The British Promotional Merchandise Association is one of four named study partners, alongside associations in Australasia, Germany and Canada. UK and Ireland figures are published separately from the global report. |
For as long as anyone has needed to size this industry, the answer has come from distributor sales figures. Those numbers are useful, and they are also partial. They describe one layer of a supply chain that begins with raw materials and ends with a product in someone’s hand, and they say nothing about the manufacturing, decoration, warehousing, logistics and activation work that sits either side of the distributor.
PPAI commissioned the independent global advisory firm Oxford Economics to close that gap. The resulting Branded Merchandise Global Market Report measures the industry across four dimensions, market spending, GDP contribution, jobs supported and tax contributions, and it counts three types of impact: the direct activity of industry firms, the indirect activity generated through their supply chains, and the induced activity created when people employed across that chain spend their wages elsewhere in the economy.
Alice Gambarin, associate director at Oxford Economics, describes it as the first study of its kind, designed to look at the industry from end to end.
| Branded merchandise worldwide, 2025 | |
| Contribution to global GDP | $472.3bn |
| Total spending on branded merchandise | $338.3bn |
| Of which promotional products | $108.6bn |
| Of which licensed merchandise | $229.7bn |
| Jobs supported worldwide | 11.9m |
| Of which directly within the industry | 4.1m |
| Global tax revenues supported | $141.3bn |
To give the headline figure a sense of scale, Oxford Economics equates $472.3 billion to roughly $1 in every $250 of global economic activity, or an economy about the size of Colombia. The tax figure alone would cover the entire 2025 budget of New York State.
The United States remains the dominant market, accounting for around 51 per cent of global branded merchandise spending and $170.2 billion of GDP contribution. Traditional promotional products spending in the US was equivalent to roughly 13 per cent of estimated American advertising spend in 2025, which is a striking measure of how much of the marketing budget this industry already commands.
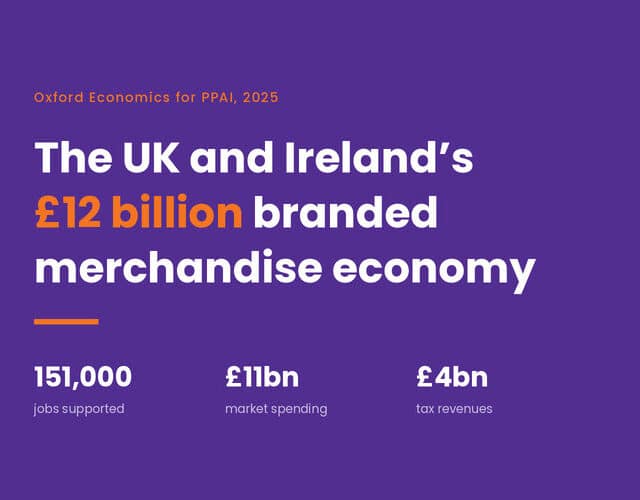
This is where the study becomes genuinely useful for the British trade. PPAI has published a separate UK and Ireland market report, produced with the BPMA as study partner, and the figures are considerably larger than the numbers this industry usually quotes about itself.
| United Kingdom and Ireland combined, 2025 | |
| Total branded merchandise spending | £11bn |
| Of which promotional products | £3bn |
| Of which licensed merchandise | £8bn |
| Contribution to GDP | £12bn |
| Share of national GDP | 0.3% |
| Jobs supported | 151,000 |
| Tax revenues supported | £4bn |
Put another way, the industry accounts for around £1 in every £290 of economic activity across the two countries, and the tax it supports is equivalent to roughly £150 per British household and £80 per Irish household. British and Irish spending together made up about 4 per cent of global branded merchandise spending in 2025.
One figure deserves particular attention. Oxford Economics estimates that spending on promotional products could represent as much as 6 per cent of total UK advertising spend. That is a materially different argument from the one this industry usually makes about itself, and it is now backed by an independent economics firm rather than by trade sentiment.
The employment breakdown is one of the more revealing parts of the UK and Ireland report. Of the 151,000 jobs supported, 71,000 are generated directly by the industry, 39,000 sit in its supply chain and a further 41,000 are supported by wage spending in the wider economy. Within those 71,000 direct jobs, the split by value layer is informative:
| Downstream, 50,000 jobs Buyer facing activity: promotional product distributors, licensed merchandise retailers, brand activation and e-commerce. |
| Midstream, 8,000 jobs Wholesaling, warehousing and decoration. In our terms, the supplier community. |
| Upstream, 13,000 jobs Manufacturing of licensed merchandise goods and blank promotional products. |
The study also notes that the branded merchandise industry directly generates more jobs than the UK’s extraction industry, which is the sort of comparison worth keeping in the back pocket for a conversation with a client or a policymaker.
Part of the reason the numbers look large is that the study works from a broader definition than the trade normally uses. Oxford Economics counted licensed merchandise, apparel and workwear, retail branded goods, creator merchandise, print on demand and e-commerce products, recognition gifts, merchandise used in marketing, and events and brand activations. The common thread is that all of them are tangible expressions of a brand.
There is a second distinction worth holding onto. Market spending and GDP contribution are not the same measure. Spending reflects the value of branded merchandise purchased. GDP contribution reflects the broader economic value the industry supports across all three channels. Conflating the two is the easiest way to misuse this research.
Licensed merchandise does most of the heavy lifting in the totals, at £8 billion of the £11 billion spent across the UK and Ireland. Strip it out entirely and roughly £3 billion still sits against promotional products. Sourcing City’s own Promotional Merchandise Industry Market Report, compiled annually since 2007, puts the UK and Ireland promotional merchandise market at £1,334 million for the same year.
Same territory. Same year. Same product category. A difference of somewhere near £1.7 billion.
| UK and Ireland promotional merchandise, 2025 | |
| Sourcing City Market Report Distributor channel, 3,008 distributor companies |
£1,334m |
| Oxford Economics for PPAI All channels, including alternative routes to market |
£3bn |
| Difference | around £1.7bn |
Geography is not the explanation. The Sourcing City report has always covered the UK and Ireland together, with the Republic of Ireland and Northern Ireland broken out separately, at £66.9 million and £14.2 million of distributor turnover respectively. Both studies describe the same islands, so the comparison is a fair one.
The real explanation is scope, and it is printed on page two of our own report. The Sourcing City study deliberately excludes sales by printers, by clothing specialists and by suppliers selling direct. It also excludes sales promotion agencies operating in the premiums market, and the incentives and motivation programme market. Read that list again with the Oxford Economics definition alongside it, and the gap stops being mysterious. Much of what we exclude by design is precisely what Oxford Economics set out to count, and they added workwear, retail branded goods, creator merchandise, print on demand and brand activation on top of it. They also went beyond distributor sales reports altogether, surveying industry buyers specifically to find spending moving through alternative channels.
| The difference between the two figures is not a discrepancy to be reconciled. It is a measure of the branded merchandise being bought across these islands with no promotional merchandise distributor anywhere near the transaction. |
Neither number is wrong. Each measures what it set out to measure. The Sourcing City figure tracks a defined channel, the 3,008 companies whose dedicated business is selling promotional merchandise to end users, and it has tracked that same channel on the same basis for eighteen years, which is exactly why its trend line is worth reading. The Oxford Economics figure measures something wider: every pound spent on branded merchandise, whoever happened to fulfil it.
What sits in the space between them is worth naming. Printers running merchandise alongside litho work. Clothing specialists decorating garments. Suppliers selling direct to end users. Print on demand platforms, retail brand shops, creator storefronts and agencies commissioning activations without a distributor in the chain. All of it is promotional merchandise by any reasonable definition, all of it is being fulfilled by somebody, and very little of it touches the channel this trade has spent forty years building.
Whether one reads that as leakage or as an addressable market rather depends on the ambition of the reader. Sourcing City has argued for some time that the boundary between promotional merchandise, print on demand and retail branded goods is dissolving, and that the distributors who prosper will be the ones who treat the whole of it as their territory. It is useful to have Oxford Economics put a number against the point. The £3 billion is the headline. The £1.7 billion is the story.
Drew Holmgreen, president and chief executive of PPAI, has framed the exercise as establishing a credible, independent and globally relevant understanding of branded merchandise, from raw material sourcing through customisation and distribution to the many ways merchandise is eventually gifted, sold and experienced. Distributor sales estimates, in his account, only ever captured one part of a much larger ecosystem.
Danny Rosin, PPAI board chair and co-president of Brand Fuel, put the human case more plainly, pointing to millions of people creating tangible connections between brands and the people they care about. “Now the world has the numbers to prove it.”
For distributors and suppliers in the UK, the practical value is straightforward. Every conversation about budget, about whether merchandise deserves a line in the marketing plan, is easier to have when the answer comes from Oxford Economics rather than from the person selling the products. A number that a finance director recognises as independently modelled carries a weight that a trade estimate never will.
| Credits and sources
The Branded Merchandise Global Market Report was commissioned by PPAI (Promotional Products Association International) and conducted by Oxford Economics. Study partners are the British Promotional Merchandise Association (BPMA), the Australasian Promotional Products Association, GWW in Germany, and Promotional Product Professionals of Canada. Comments quoted are from PPAI’s own coverage of the study, reported by Jonny Auping, senior news editor at PPAI Media, published 8 September 2026. Sourcing City is grateful to PPAI for making the research and its country level data publicly available. Read the original PPAI article: Global Economic Impact Study Reveals Branded Merch’s $472 Billion Footprint Figures are for 2025 and are stated as published by PPAI and Oxford Economics. Global figures are in US dollars. UK and Ireland figures are in pounds sterling and cover both countries combined. The full report is available to PPAI Professional Members. All rights in the underlying research remain with PPAI and Oxford Economics Ltd. Comparison figures for the promotional merchandise channel are drawn from the Promotional Merchandise Industry Market Report, Year Ending 2025, compiled by Sourcing City and published annually since 2007. Oxford Economics publishes its UK and Ireland promotional products figure rounded to the nearest billion pounds, so the difference between the two studies is necessarily stated as an approximation. |
The quality of entries submitted for this year’s BPMA Product Awards has been truly outstanding, with suppliers showcasing…
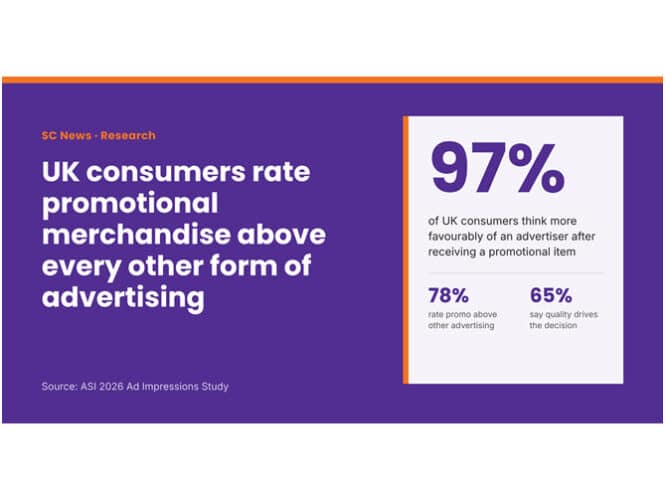
Read moreNew research from ASI, presented at the GXN Annual Conference in Kitzbühel this month, puts the UK among the most receptive markets in Europe for promotional merchandise. It also shows, quite precisely, what turns a welcome item into one that gets kept.
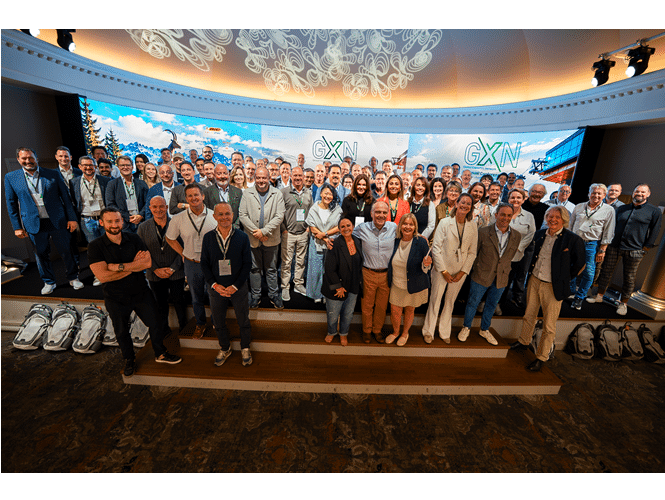
Read moreIndustry leaders adopt the Kitzbühel Declaration 2030, setting out eight guiding principles under GXN’s One Voice Initiative.
Read more